Consolidated Balance Sheet
Consolidated Cash Flow Statement
Summary of Consolidated Balance Sheet
(Million JPY)
| FYE 3/2025 | FYE 3/2026 | Year-on-Year | ||
|---|---|---|---|---|
| Current assets | 54,169 | 61,132 | 6,963 | |
| Cash and deposits | 21,846 | 28,243 | 6,396 | |
| Trade receivables | 25,423 | 23,956 | -1,467 | |
| Inventories | 5,696 | 7,451 | 1,755 | |
| Non-current assets | 33,637 | 36,105 | 2,467 | |
| Property, plant and equipment | 13,871 | 16,727 | 2,855 | |
| Intangible non-current assets | 9,821 | 8,189 | -1,632 | |
| Investments and other assets | 9,944 | 11,188 | 1,244 | |
| Total assets | 87,807 | 97,237 | 9,430 | |
| Current liabilities | 27,595 | 30,692 | 3,069 | |
| Notes and accounts payable - trade | 4,838 | 5,616 | 777 | |
| Contract liabilities | 11,076 | 12,019 | 943 | |
| Short-term loans payable | 3,954 | 3,969 | 14 | |
| Non-current liabilities | 14,887 | 14,982 | 94 | |
| Long-term loans payable | 10,594 | 10,393 | -200 | |
| Total liabilities | 42,483 | 45,675 | 3,191 | |
| Total equity | 45,323 | 51,562 | 6,238 | |
| Total liabilities and equity | 87,807 | 97,237 | 9,430 | |
Summary of Consolidated Cash Flow Statement
(Million JPY)
| FYE 3/2025 | FYE 3/2026 | ||
|---|---|---|---|
| Cash flows from operating activities (A) | 3,272 | 9,449 | |
| Profit before income taxes | 5,300 | 7,892 | |
| Depreciation | 1,287 | 1,625 | |
| Amortization of goodwill | 1,047 | 1,137 | |
| (Increase) decrease in trade receivables and contract assets | (4,148) | 1,656 | |
| (Increase) decrease in inventories | (425) | (1,376) | |
| (Increase) decrease in trade and other receivables | 1,129 | 524 | |
| Income taxes (paid) refund | (1,178) | (2,547) | |
| Cash flows from investing activities (B) | (3,401) | (1,357) | |
| Purchase of property, plant and equipment | (3,005) | (3,548) | |
| Cash flows from financing activities (C) | (1,180) | (3,176) | |
| Net increase/decrease in interest-bearing debt | (277) | (1,166) | |
| Dividends paid | (838) | (1,105) | |
| Total (A+B+C) | (1,309) | 4,915 | |
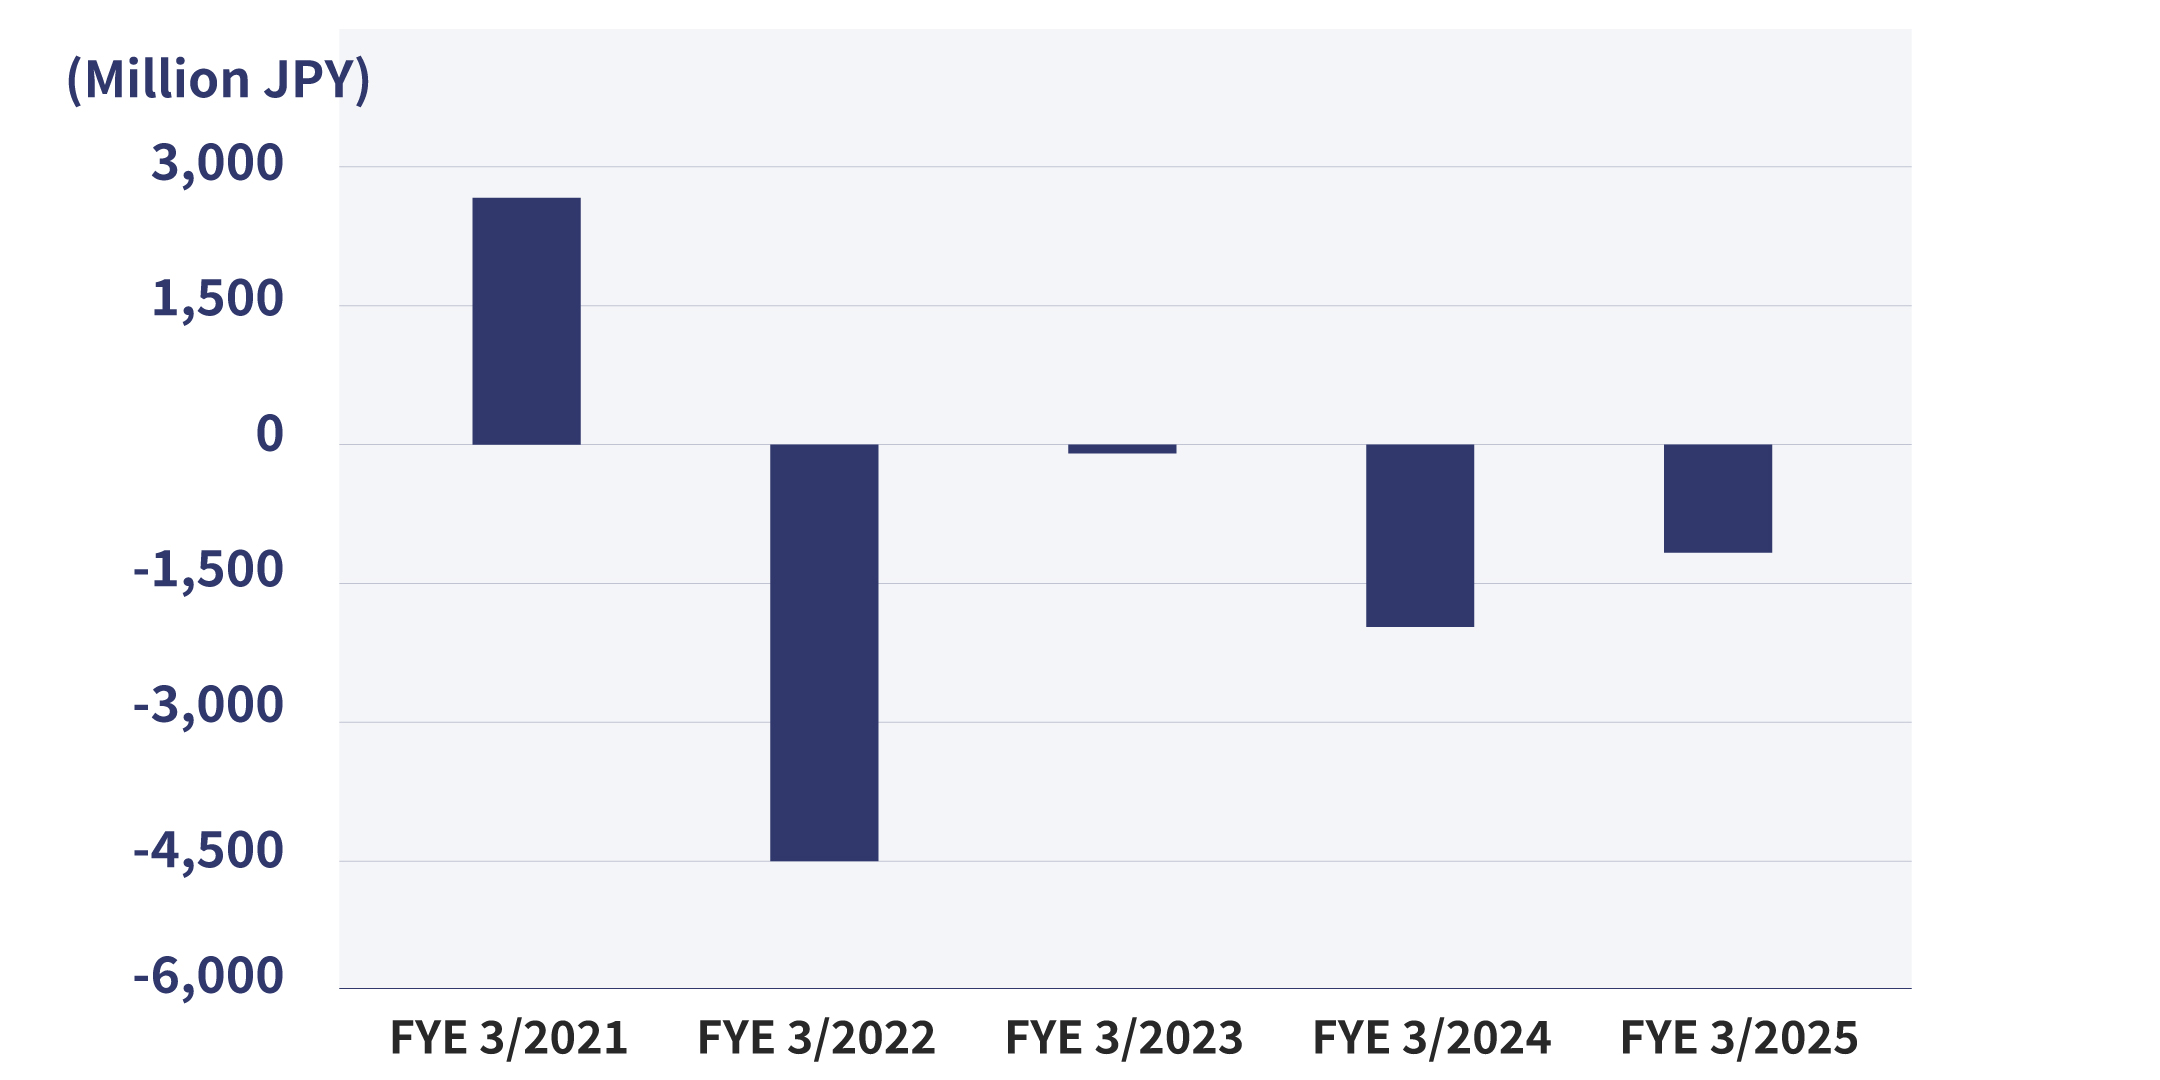
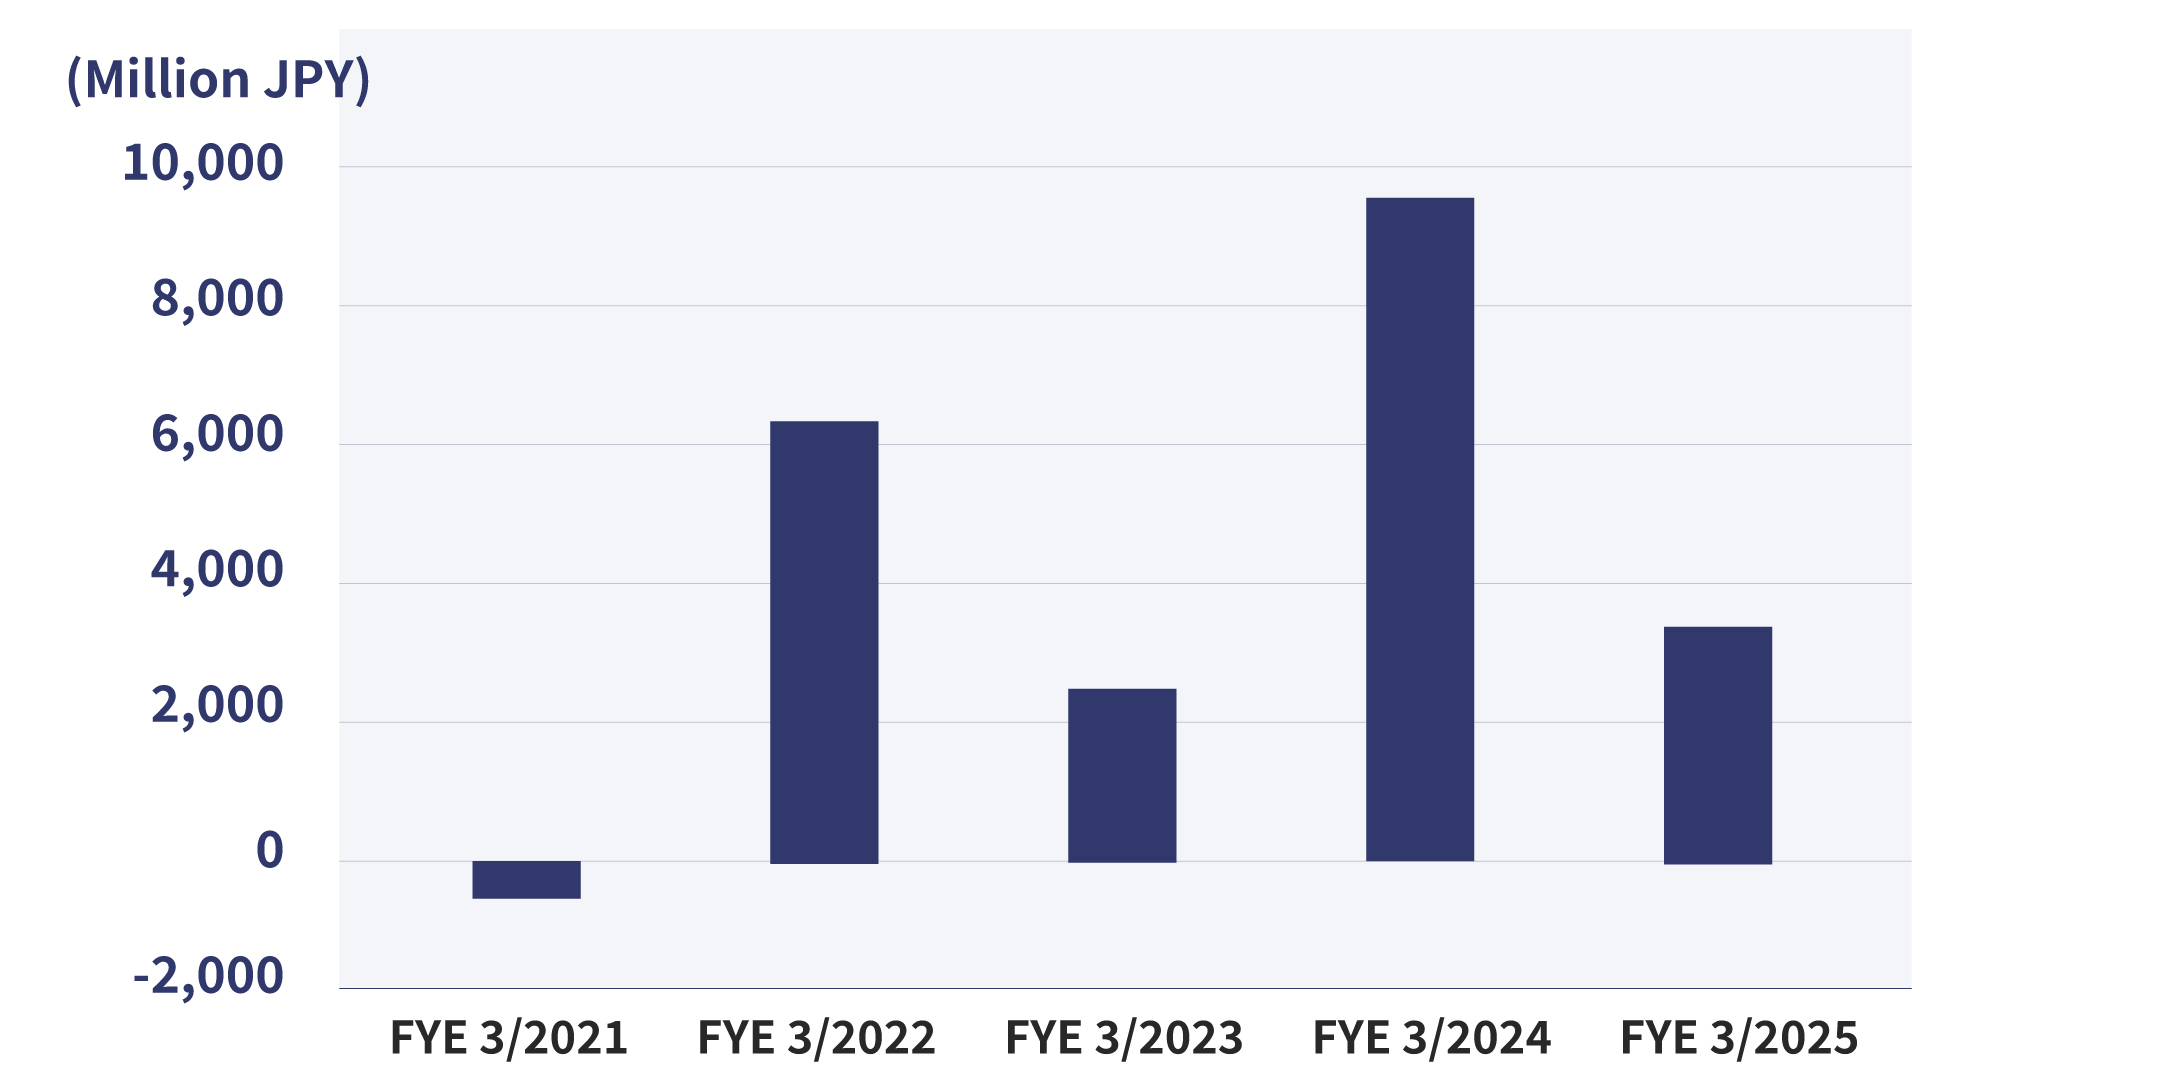
Operating Activities Cash Flow
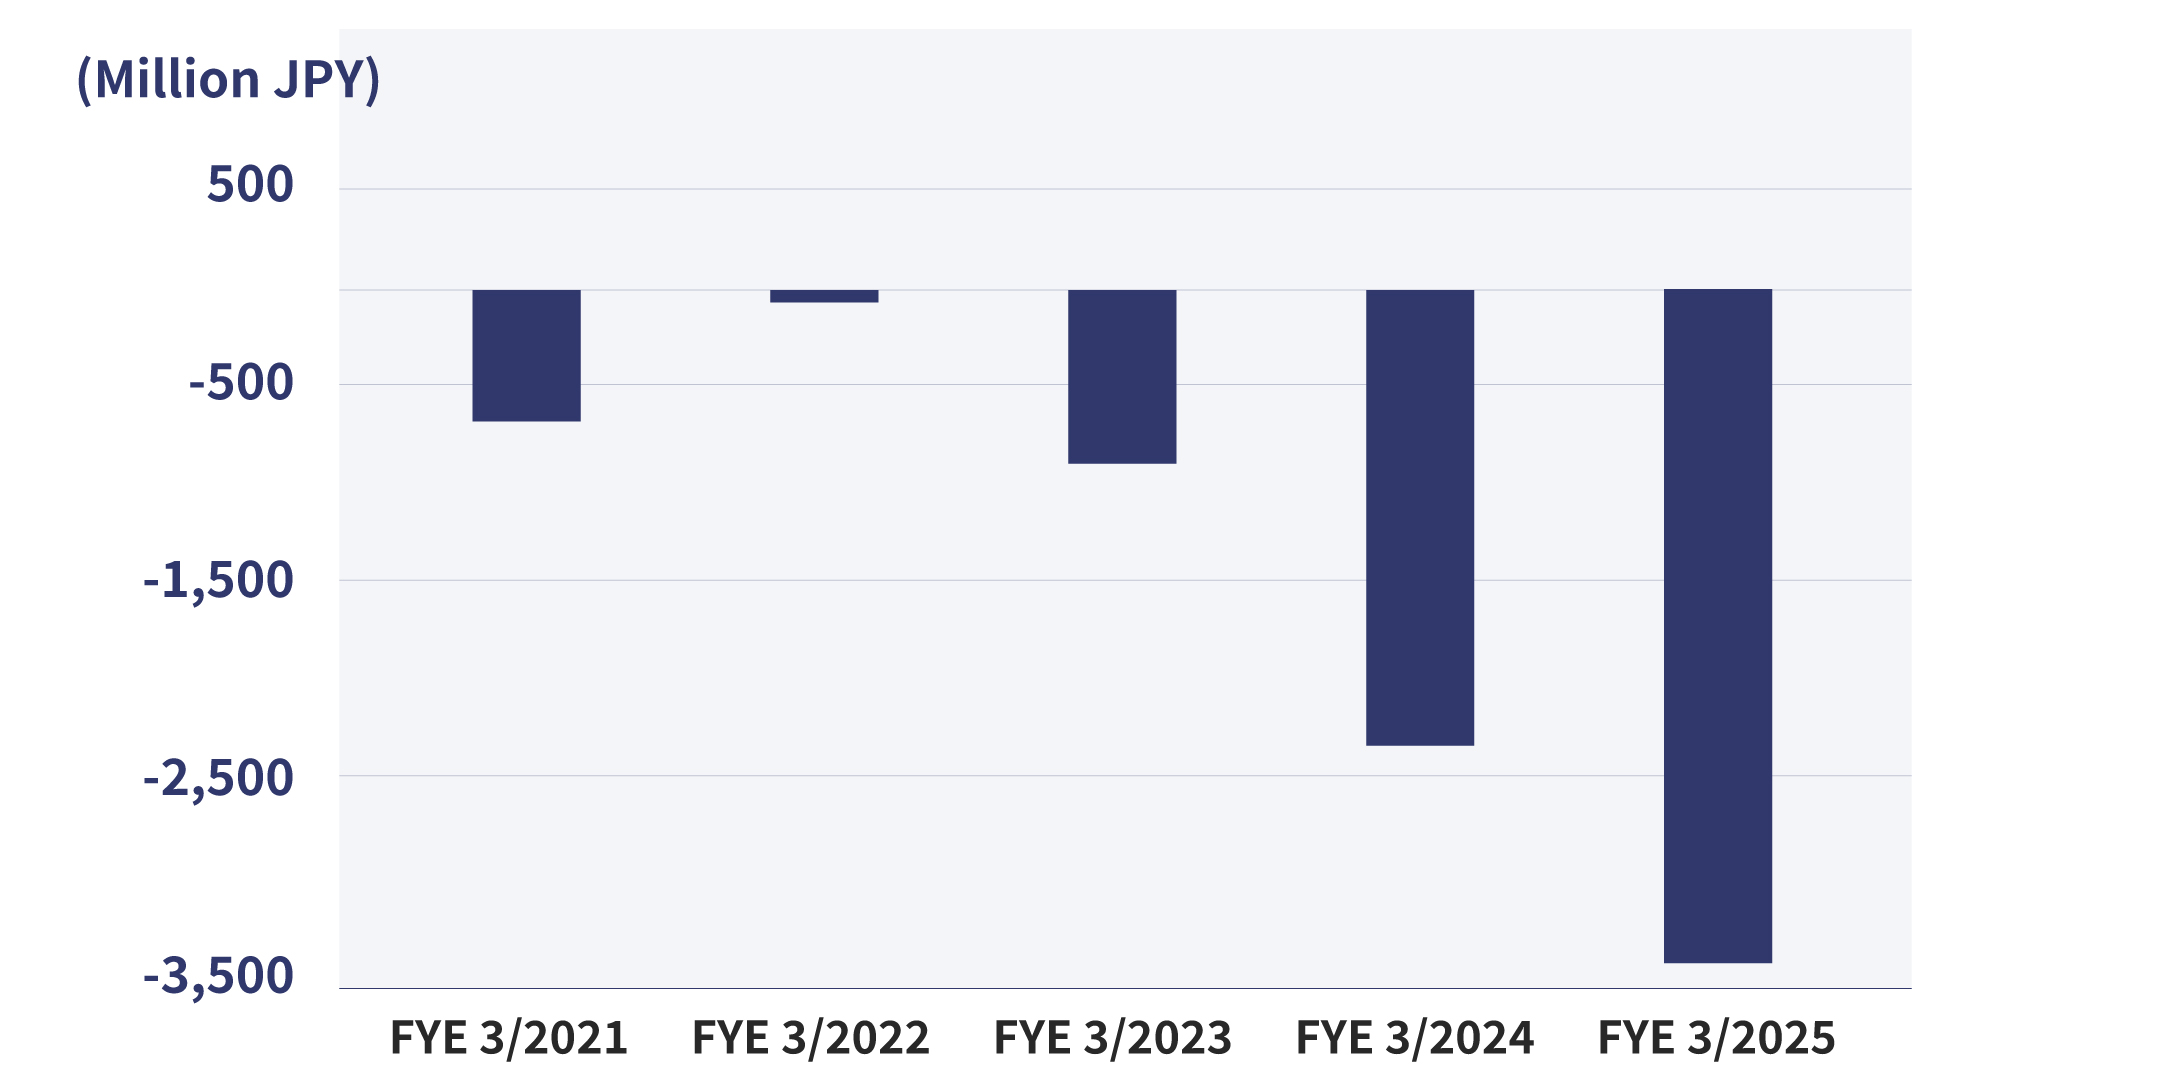
Investing Activities Cash Flow
Financing Activities Cash Flow