Summary of
Financial Results
Quarterly
Summary
(Million JPY)
| FYE 3/2025 | FYE 3/2026 | Year-on-Year | |
|---|---|---|---|
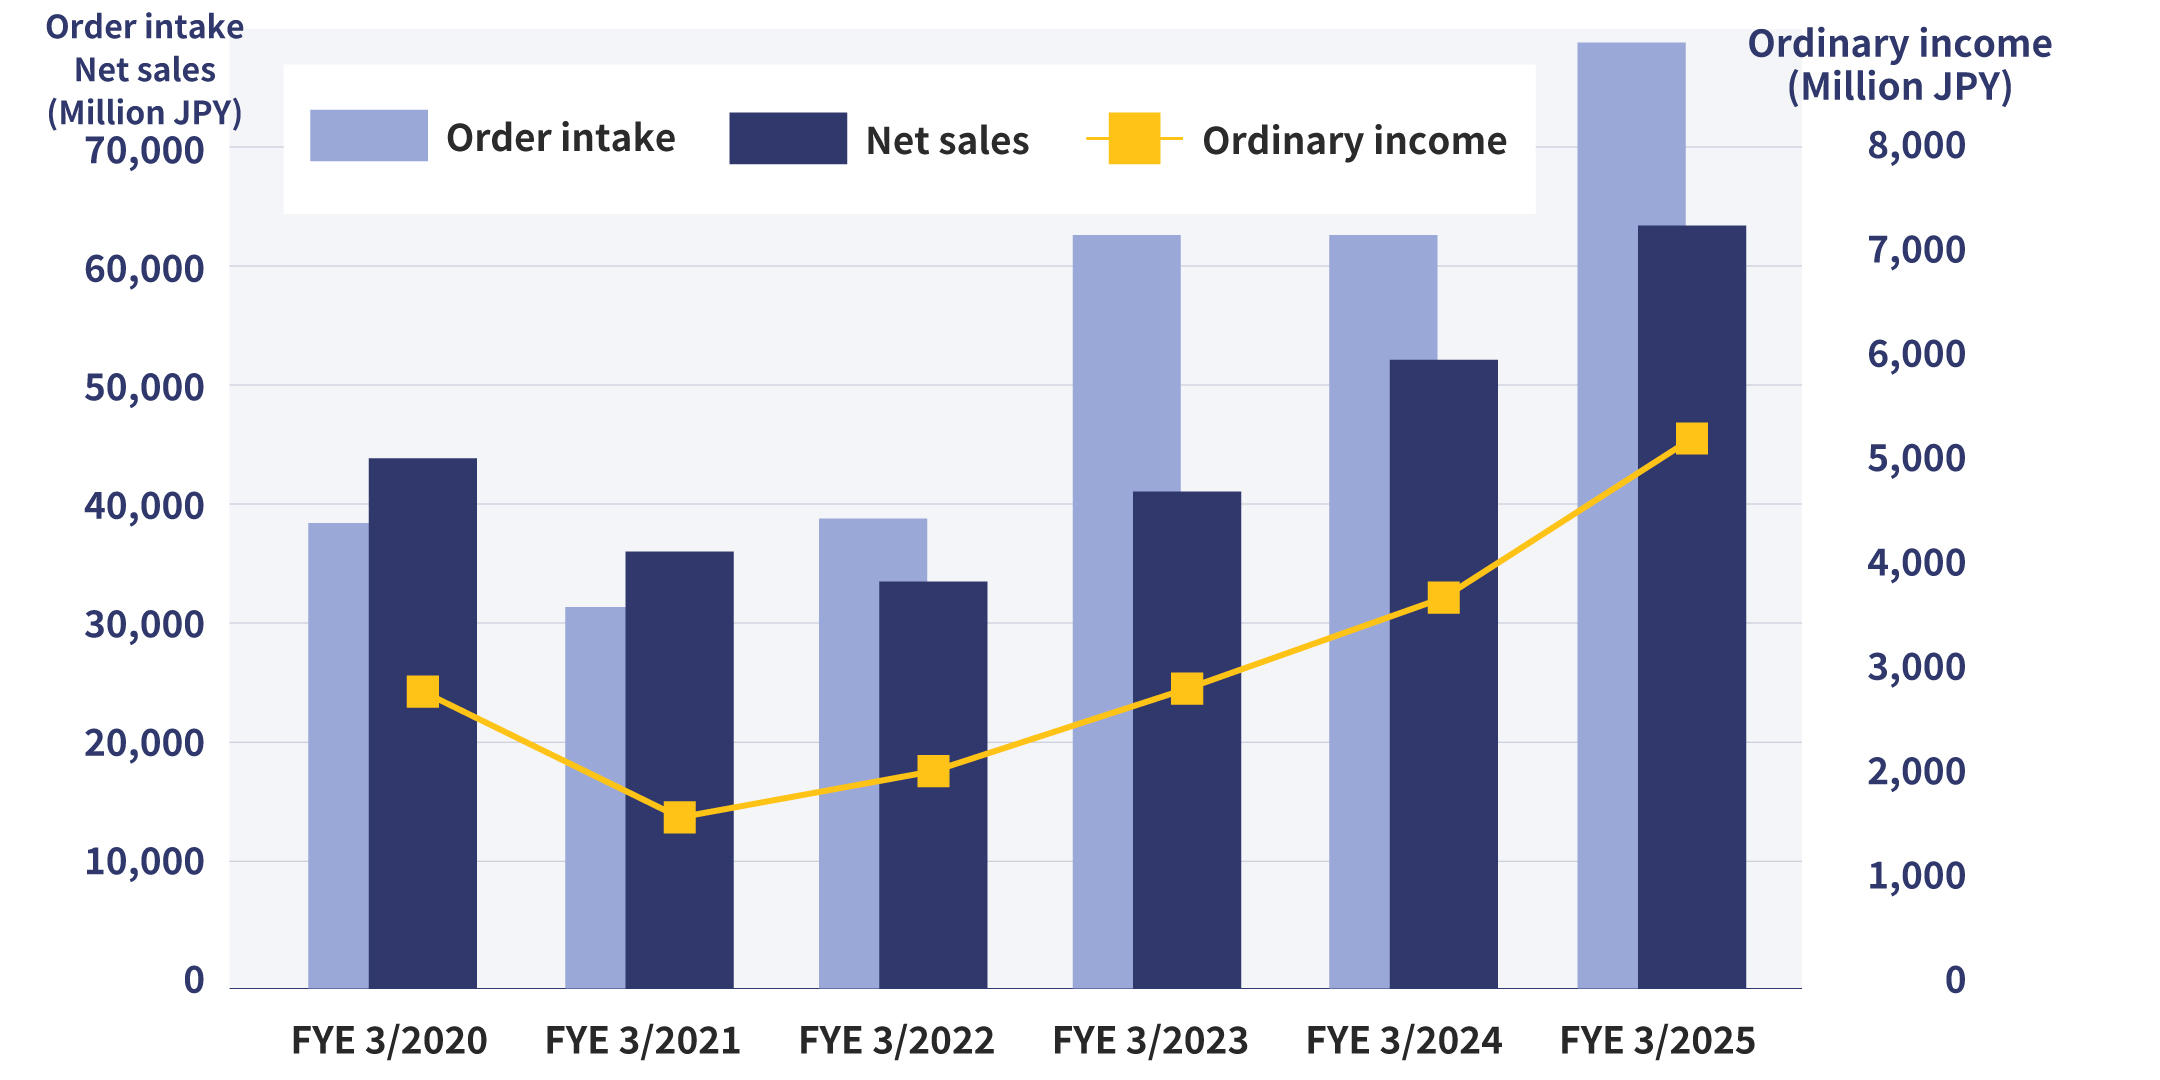
| Order intake | 78,841 | 81,552 | +2,711 (+3.4%) |
| Net sales | 61,861 | 73,070 | +11,208 (+18.1%) |
| Operating income | 4,797 | 6,570 | +1,772 (+37.0%) |
| Ordinary income | 5,293 | 6,792 | +1,498 (+28.3%) |
| Net income attributable to owners of parent | 2,995 | 5,102 | +2,106 (+70.3%) |
Quarterly Summary
(Million JPY)
| FYE 3/2026 | Q1 | Q2 | H1 | Q3 | Q4 | H2 | Annual |
|---|---|---|---|---|---|---|---|
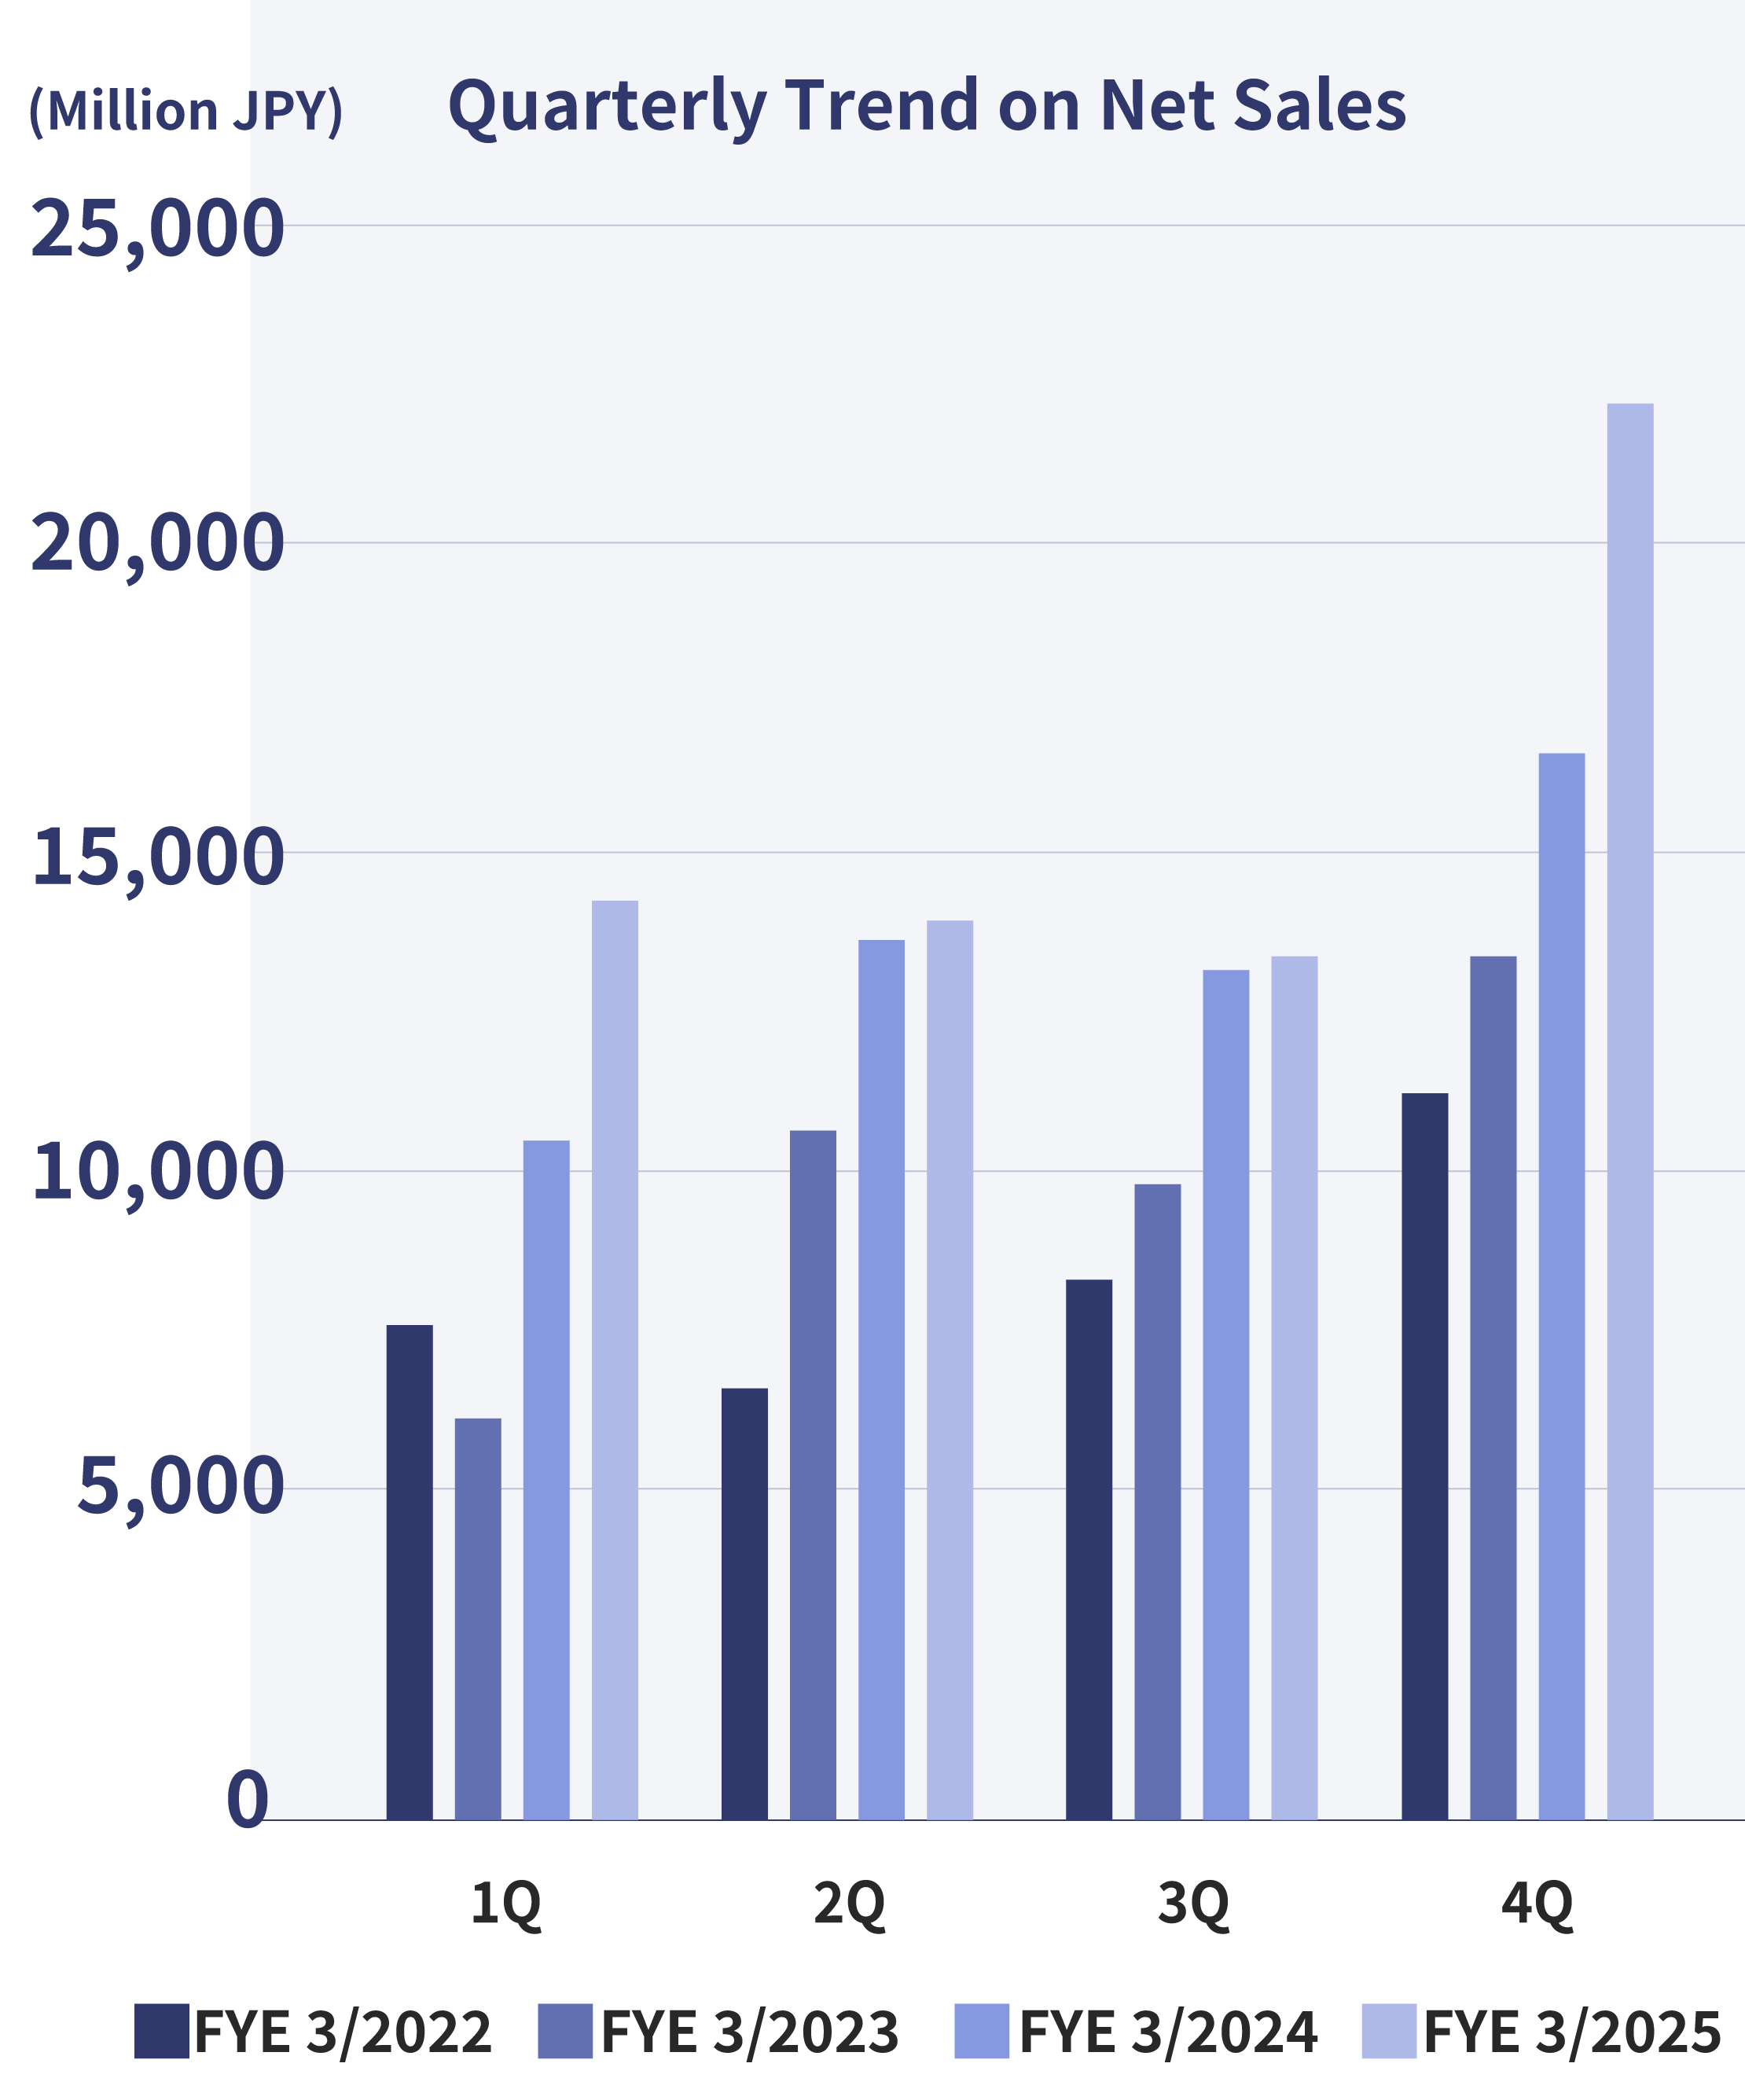
| Net sales | 15,260 | 16,721 | 31,981 | 17,217 | 23,870 | 41,088 | 73,070 |
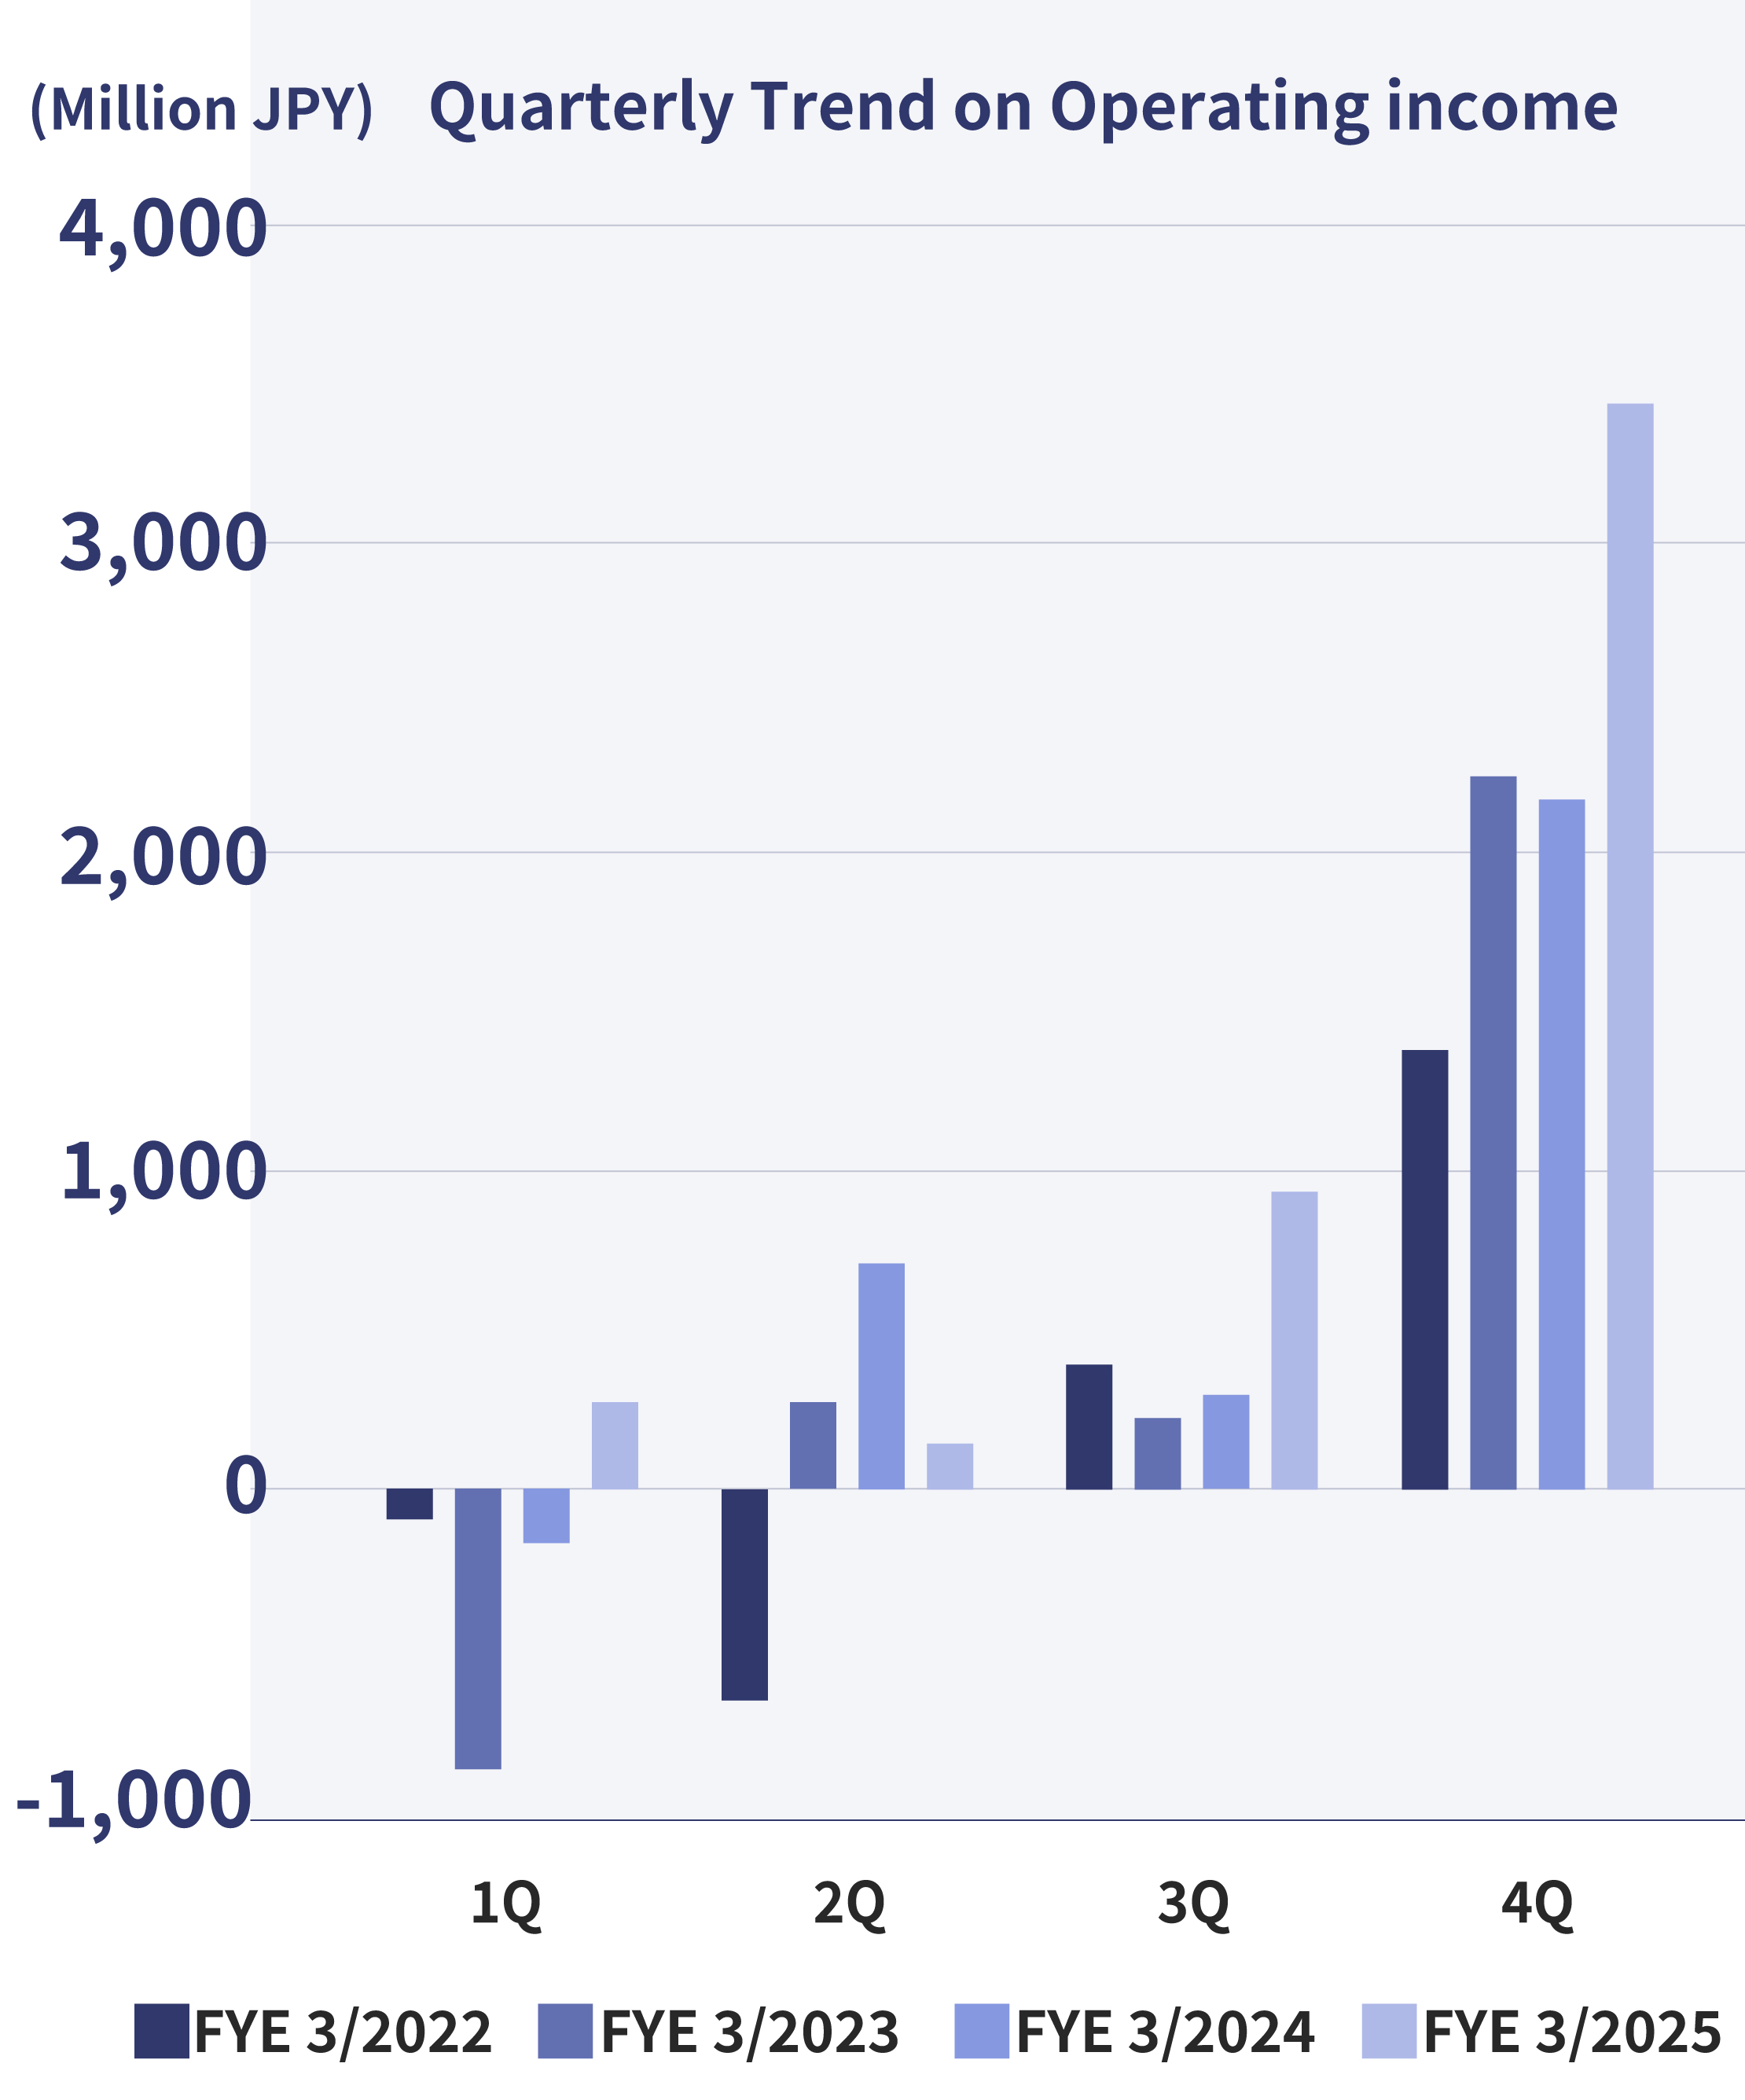
| Operating income | 799 | 1,229 | 2,029 | 1,181 | 3,359 | 4,541 | 6,570 |
| Ordinary income | 960 | 1,213 | 2,173 | 1,264 | 3,353 | 4,618 | 6,792 |
| Net income attributable to owners of parent |
496 | 701 | 1,197 | 1,827 | 2,541 | 3,904 | 5,102 |
(Million JPY)
| FYE 3/2025 | Q1 | Q2 | H1 | Q3 | Q4 | H2 | Annual |
|---|---|---|---|---|---|---|---|
| Net sales | 13,750 | 13,600 | 27,350 | 12,811 | 21,699 | 34,511 | 61,861 |
| Operating income | 307 | 167 | 475 | 957 | 3,363 | 4,321 | 4,797 |
| Ordinary income | 519 | 223 | 742 | 1,131 | 3,419 | 4,551 | 5,293 |
| Net income attributable to owners of parent |
231 | 72 | 303 | 150 | 2,541 | 2,691 | 2,995 |