Summary of
Financial Results
Quarterly
Summary
Summary of Financial Results for FYE3/2025 (April 2024 – March 2025)
During the fiscal year ended March 31, 2025, the Japanese economy was on a moderate recovery trend mainly due to the improving employment and income environment and the increase in inbound demand. On the other hand, the Japanese economy continued to face an uncertain outlook due to various concerns, including high and rising raw material and energy prices on the back of the protracted conflict in Ukraine and the situation in the Middle East, downside risks to the Japanese economy from the slowdown of overseas economies, the direction of U.S. policies, and the effect of changes in the financial and capital markets.
In such an environment, the Group worked to improve its business performance in each of its operating segments, which are Amusement Rides, Stage Equipment, and Elevators segments through efforts to streamline their operations further and aggressive sales activities.
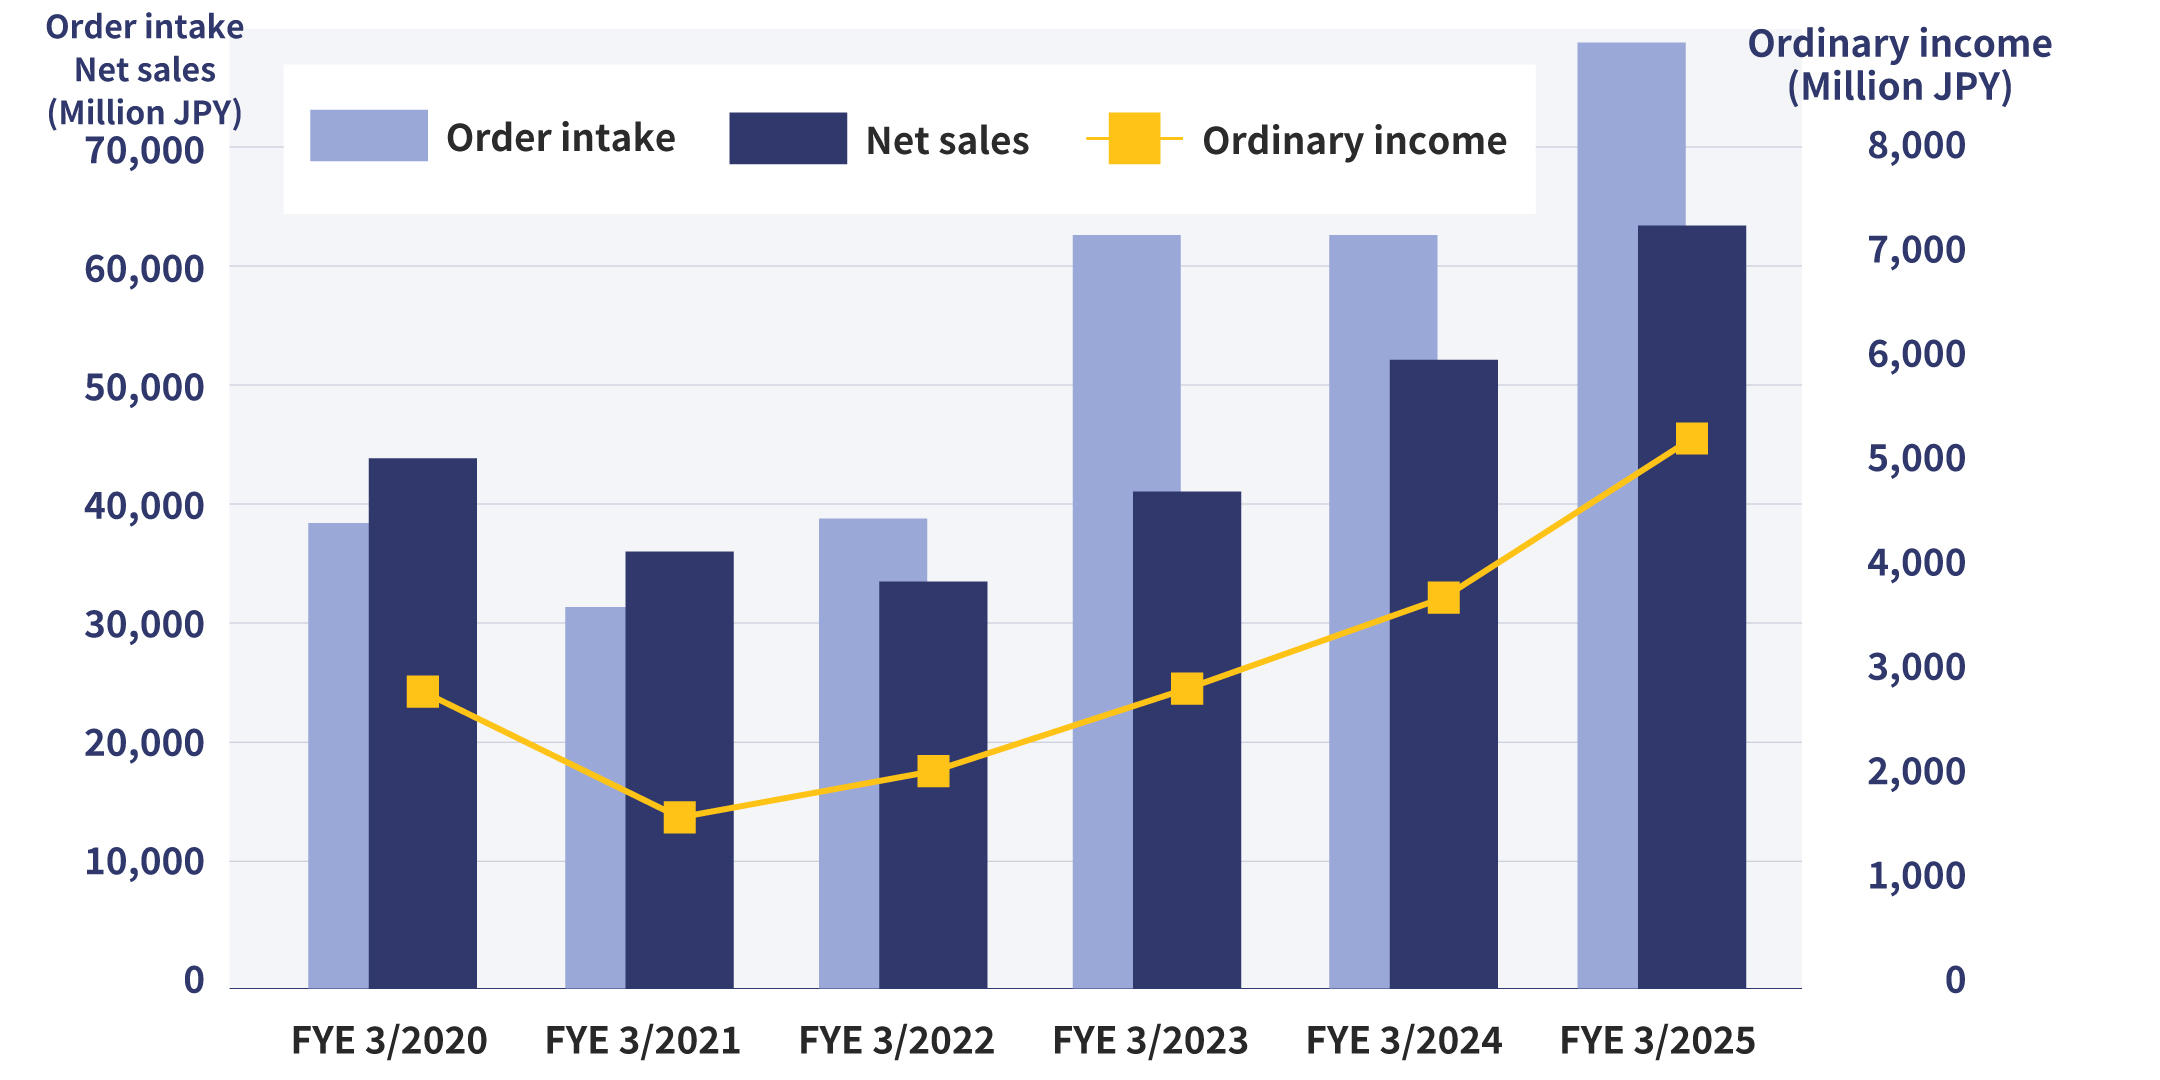
For consolidated order intake, we achieved 78,841 million JPY (a 30.3% increase from the previous term), attributable to major project orders in Japan and overseas for Amusement Rides, growing demand for temporary stage sets in Stage Equipment, and stable renovation project orders.
As a result, the Group achieved year-on-year growth, as shown below.
(Million JPY)
| FYE 3/2024 | FYE 3/2025 | Year-on-Year | |
|---|---|---|---|
| Order intake | 60,486 | 78,841 | +18,355 (+30.3%) |
| Net sales | 52,307 | 61,861 | +9,554 (+18.3%) |
| Operating income | 3,155 | 4,797 | +1,641 (+52.0%) |
| Ordinary income | 3,597 | 5,293 | +1,696 (+47.2%) |
| Net income attributable to owners of parent | 2,071 | 2,995 | +923 (+44.6%) |

Quarterly Summary
(Million JPY)
| FYE 3/2025 | Q1 | Q2 | H1 | Q3 | Q4 | H2 | Annual |
|---|---|---|---|---|---|---|---|
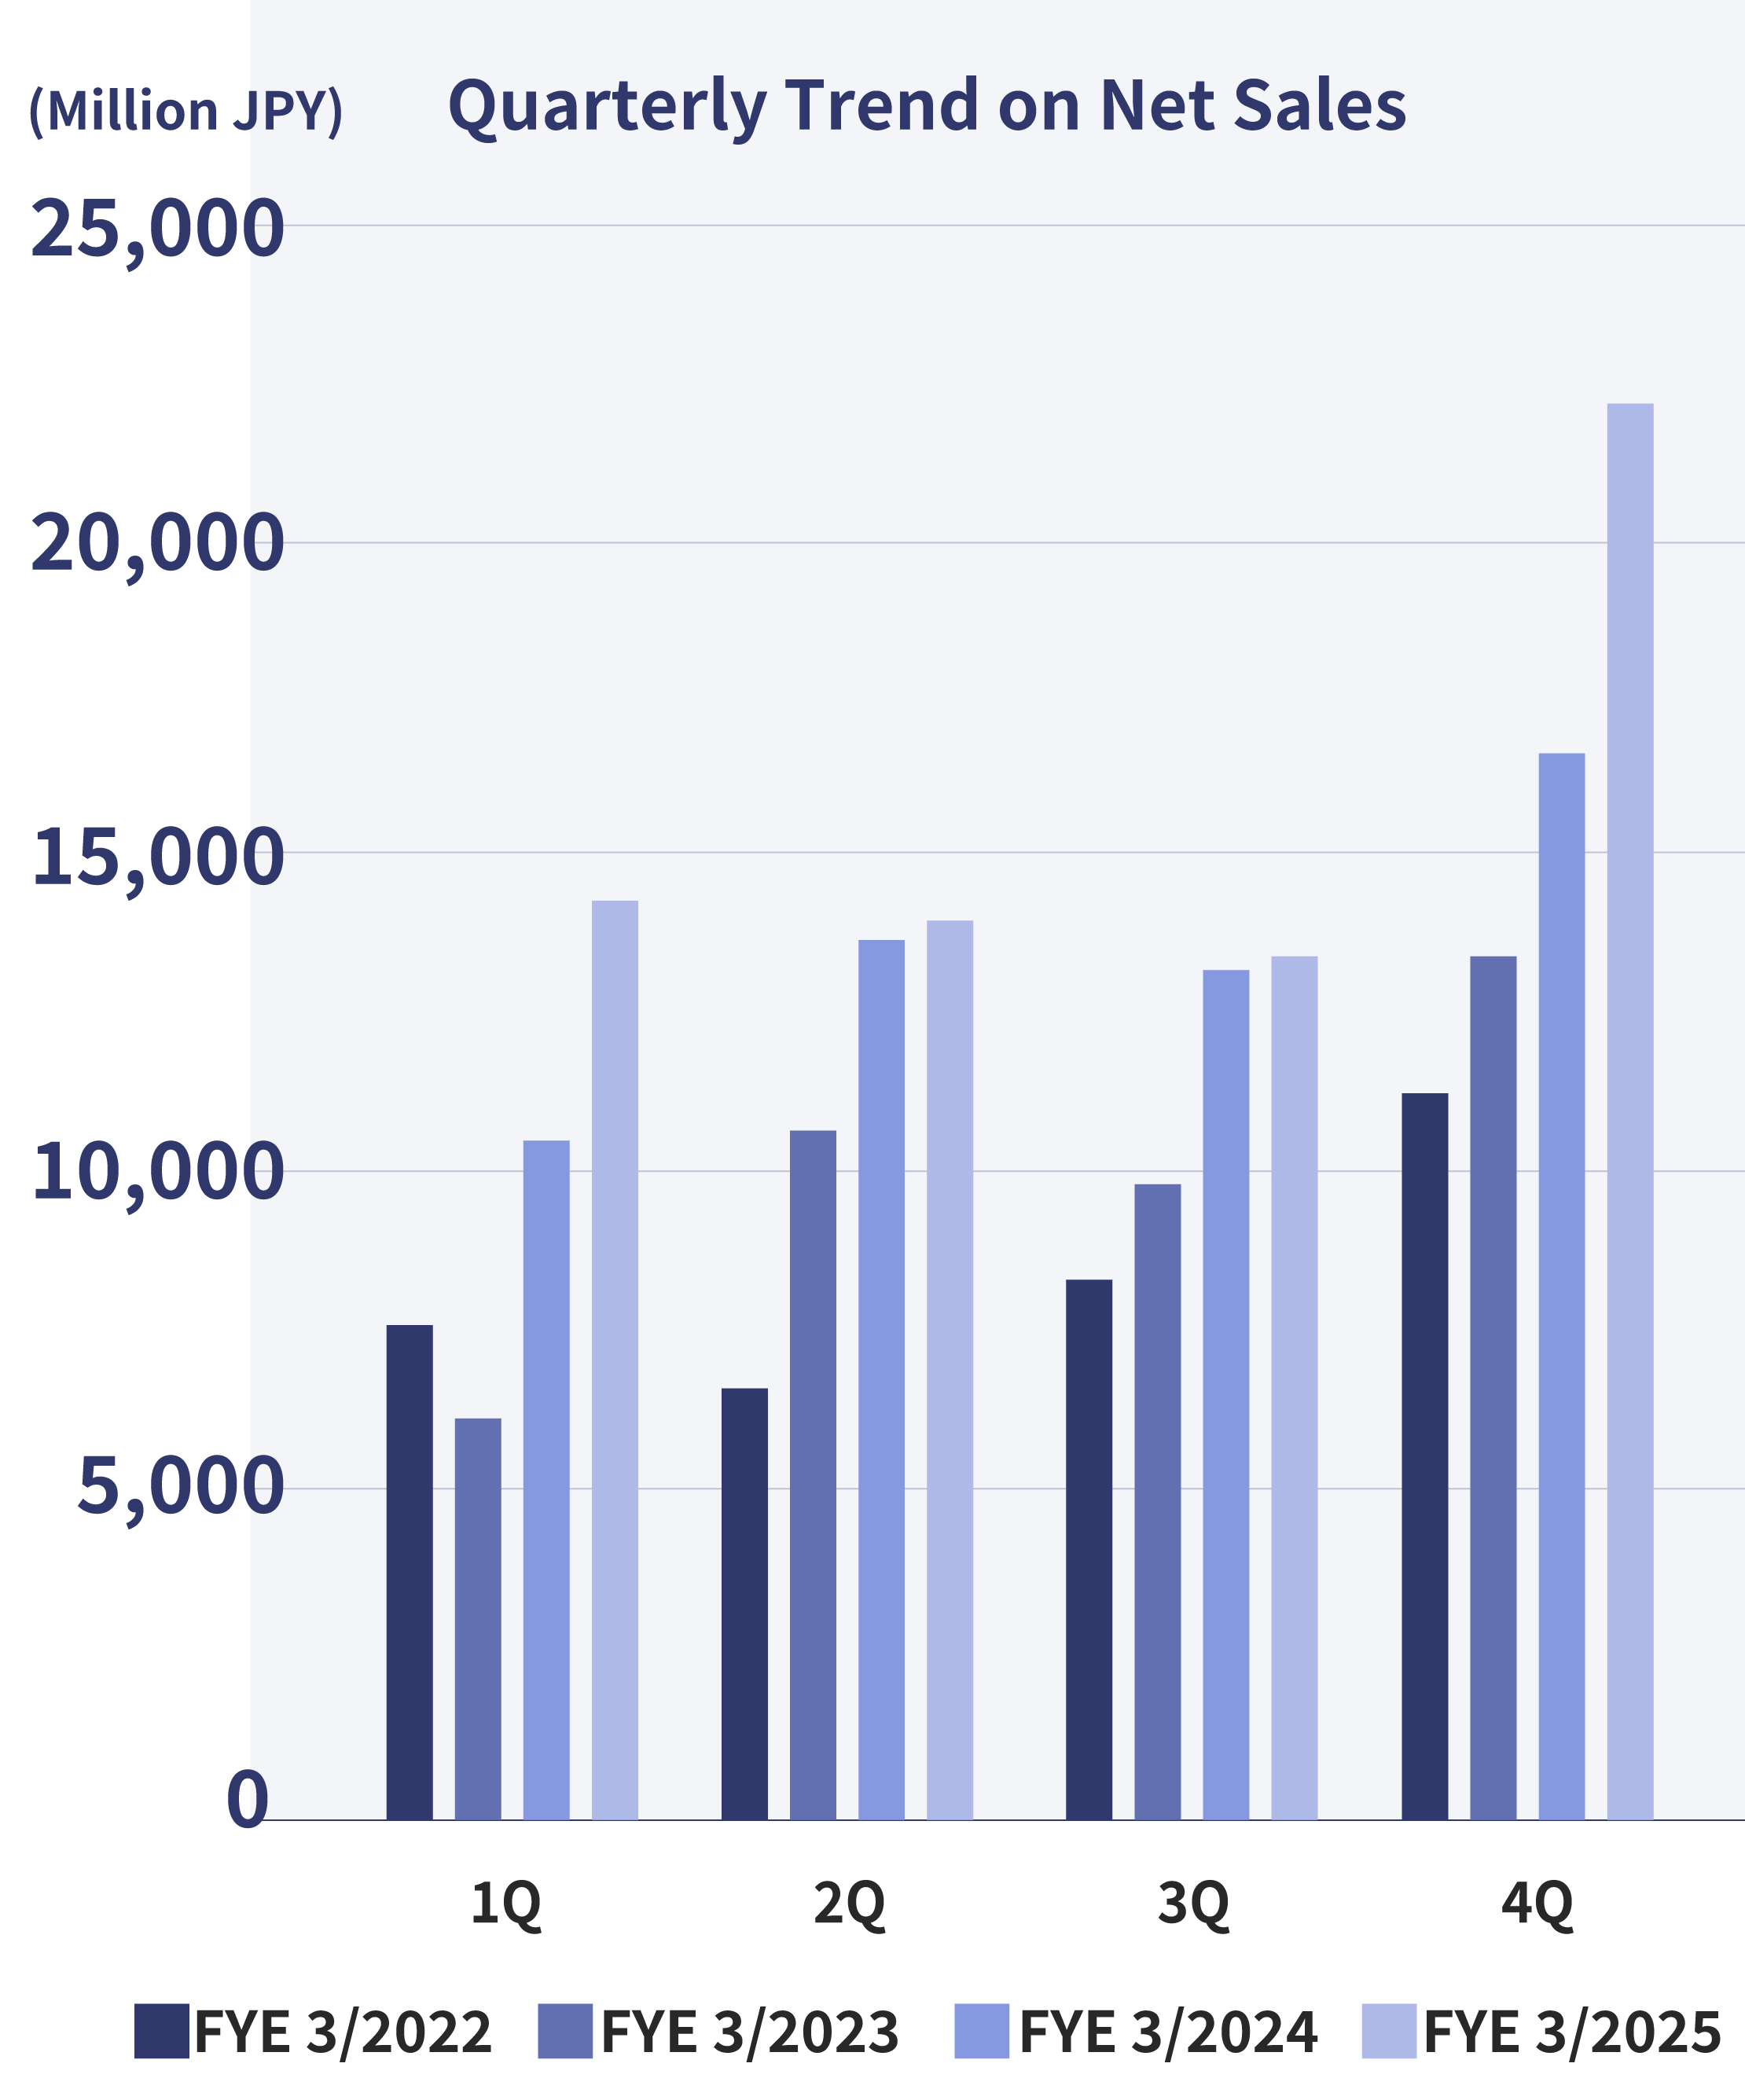
| Net sales | 13,750 | 13,600 | 27,350 | 12,811 | 21,699 | 34,511 | 61,861 |
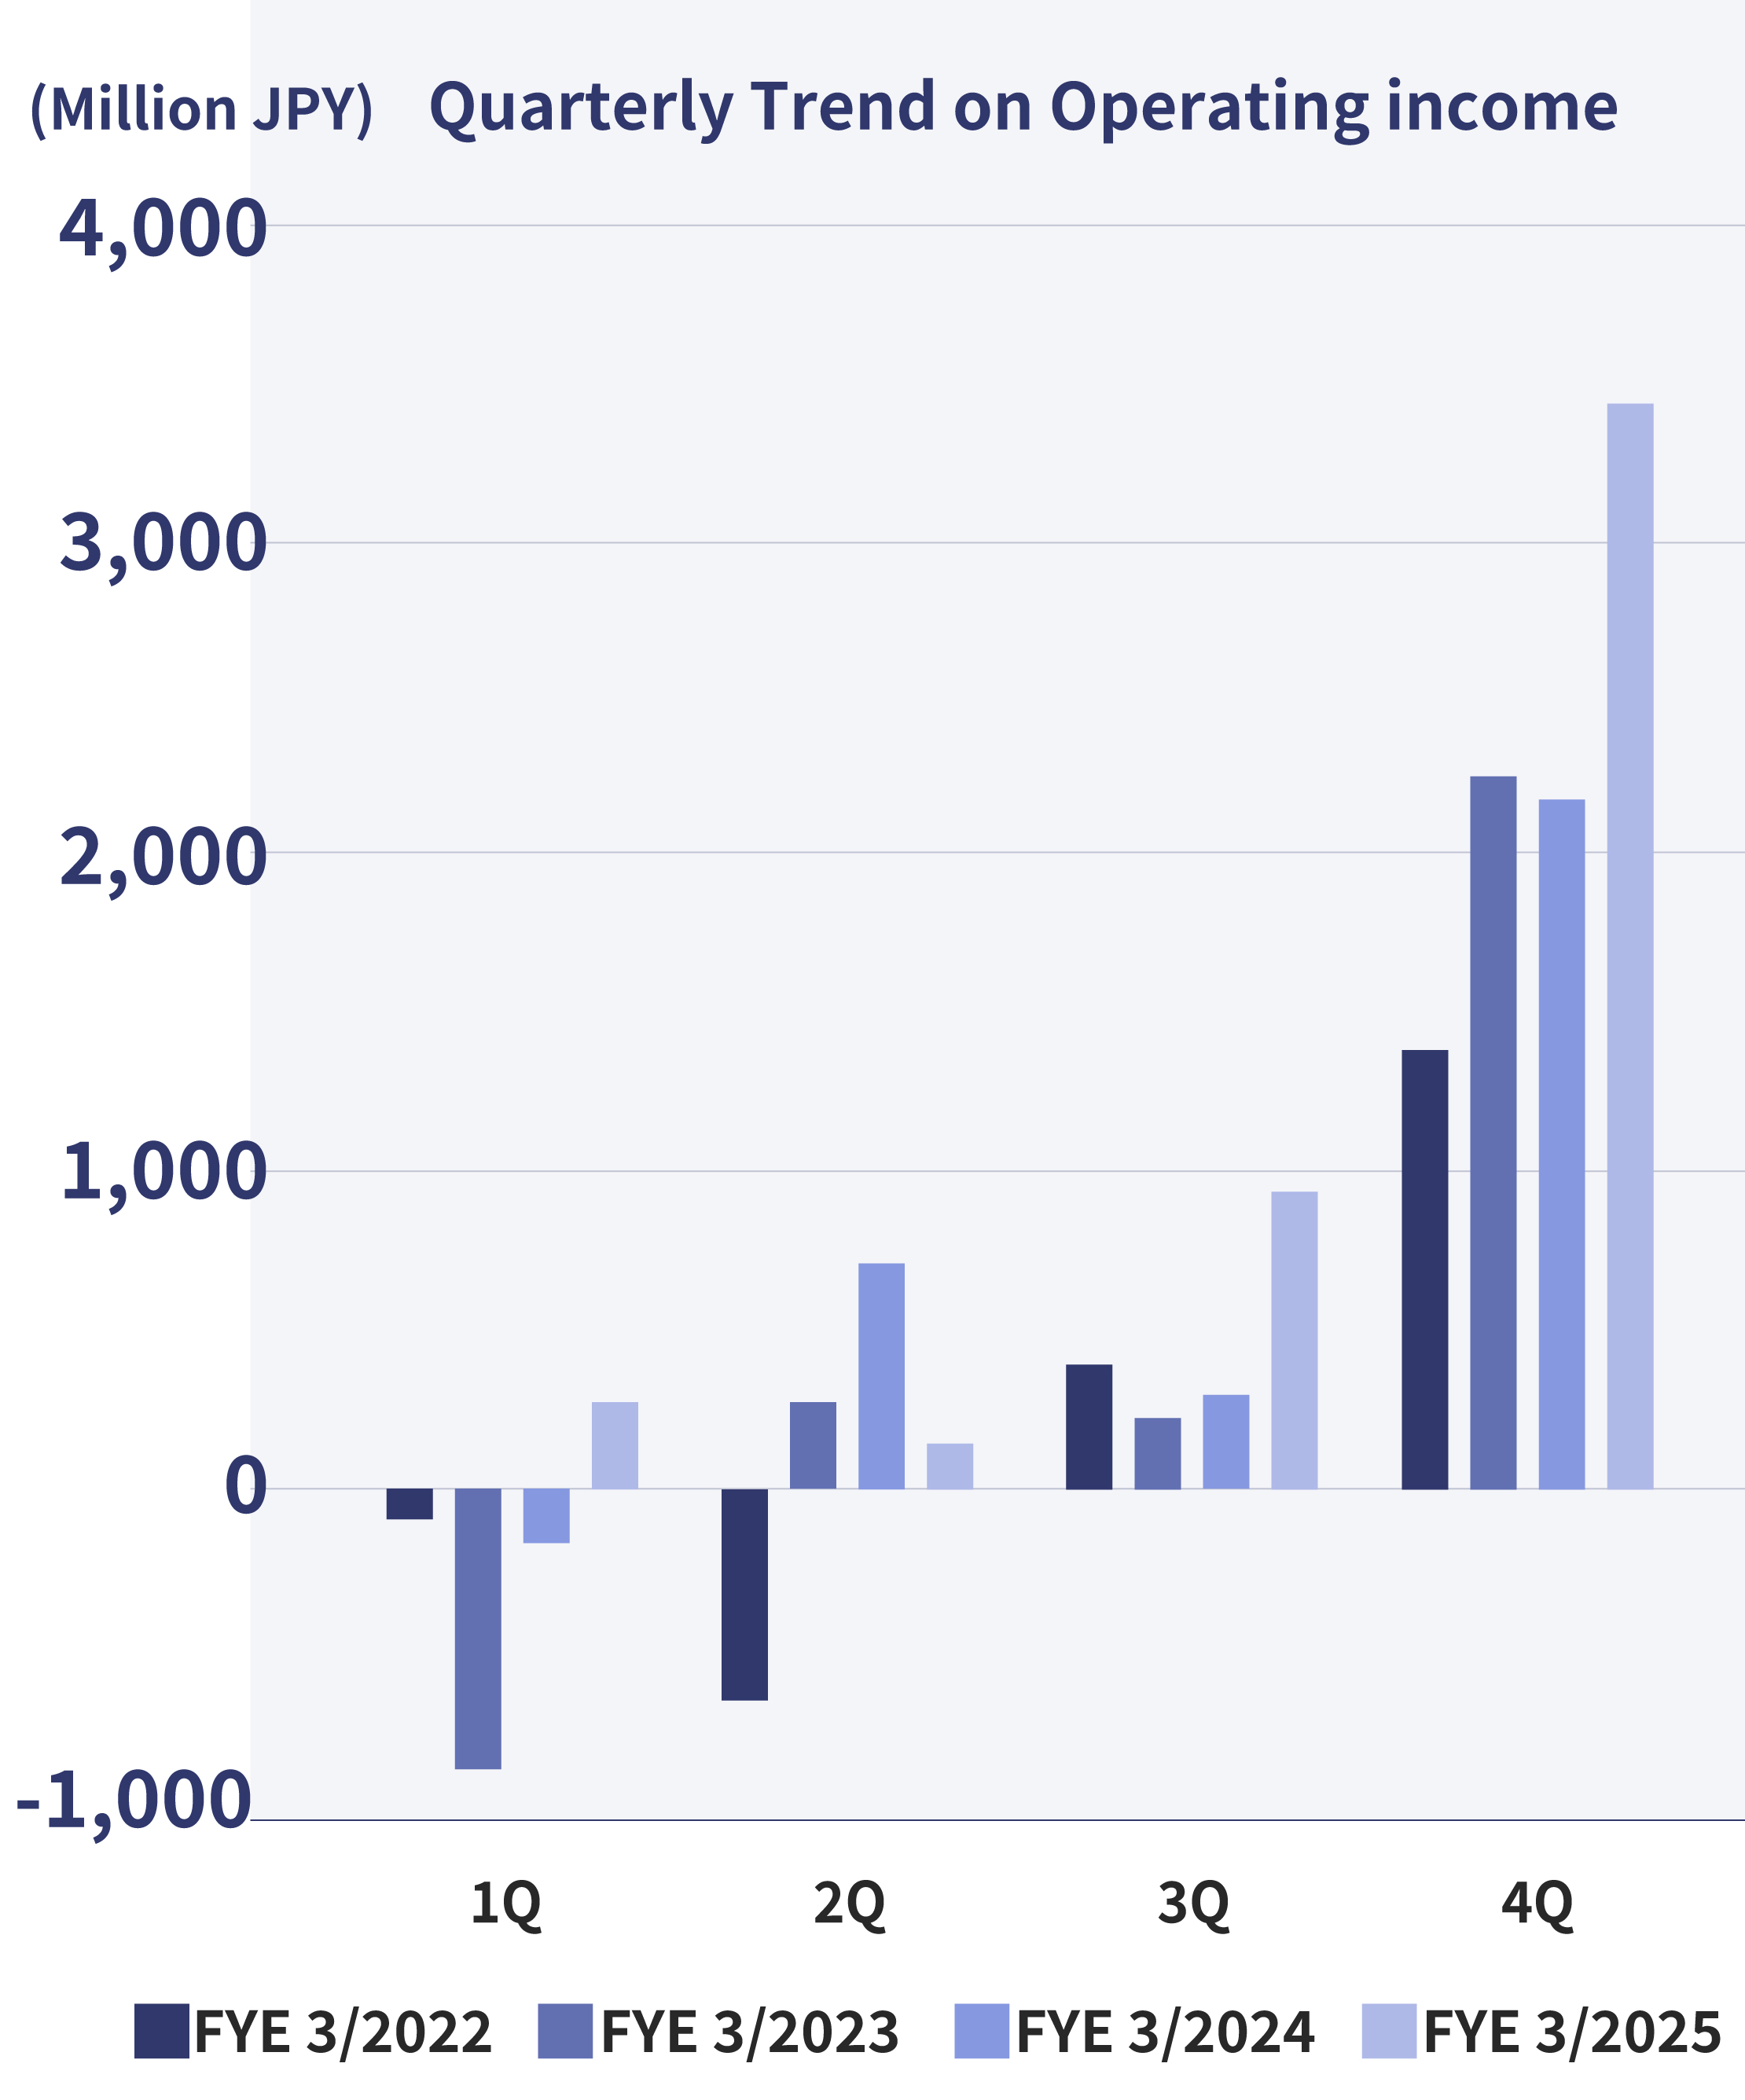
| Operating income | 307 | 167 | 475 | 957 | 3,363 | 4,321 | 4,797 |
| Ordinary income | 519 | 223 | 742 | 1,131 | 3,419 | 4,551 | 5,293 |
| Net income attributable to owners of parent |
231 | 72 | 303 | 150 | 2,541 | 2,691 | 2,995 |
(Million JPY)
| FYE 3/2024 | Q1 | Q2 | H1 | Q3 | Q4 | H2 | Annual |
|---|---|---|---|---|---|---|---|
| Net sales | 10,184 | 13,190 | 23,375 | 12,556 | 16,375 | 28,931 | 52,307 |
| Operating income | -188 | 711 | 523 | 343 | 2,288 | 2,632 | 3,155 |
| Ordinary income | -125 | 734 | 609 | 481 | 2,507 | 2,988 | 3,597 |
| Net income attributable to owners of parent |
-167 | 414 | 247 | 209 | 1,615 | 1,824 | 2,071 |


